Inputs and Outputs
Inputs
Suite2p output files:
stat.npyandops.npyfiles only.Other data formats: Support for formats like CaImAn, custom ROIs, etc., can be facilitated through a custom data importing notebook found here.
Outputs
The outputs of ROICaT tracking are encapsulated in a set of files. The main file
is a ...tracking.results_all.richfile (directory or archive) that can be
loaded using roicat.util.RichFile_ROICaT. Multiple storage backends are
supported: 'directory' (default, produces a folder tree), 'sqlar'
(single SQLite archive), 'zip' (single ZIP file), and 'tar' (single TAR
file). The backend can be configured via
params['results_saving']['richfile_backend']. The result is a python
dictionary with the following fields:
Clusters
labels: Unique Cluster IDs (aka ‘UCIDs’) for each ROI. These are integer labels indicating which cluster each ROI belongs to.
-1indicates an ROI that was not clustered. Array of shape:(n_ROIs_total,).labels_bySession: UCIDs for each ROI, by session. List of length
n_sessions, where each element is an array of shape(n_ROIs_session,).labels_bool: Sparse boolean matrix describing which ROIs are in which clusters. Rows are ROI indices, columns are UCIDs + 1.
labels_bool_bySession: Same as
labels_bool, but by session.labels_dict: Dictionary mapping UCIDs to ROI indices. Keys are UCIDs, values are lists of ROI indices.
quality_metrics: Dictionary of quality metrics for each cluster. See below section Quality Metrics for more details.
ROIs
ROIs_aligned: Images of all ROIs, aligned by session.
ROIs_raw: Raw spatial footprints of the ROIs.
frame_height, frame_width: Dimensions of the Field of View (FOV).
idx_roi_session: Session-wise ROI indices.
n_sessions: Number of sessions.
Applying labels to Data
You can use the output labels to align any data with the same indexing as the ROIs like time series (calcium traces). ROICaT provides a set of functions to help with this. The term “UCID” (Unique Cluster ID) is used to refer to the cluster labels. All functions are within the roicat.util module.
roicat.util.match_arrays_with_ucids: Align data using UCIDs. This function will align data arrays (e.g., calcium traces) using the UCIDs.roicat.util.mask_UCIDs_with_iscell: Update UCIDs based on aniscellarray (provided by Suite2p or ROICaT classification). This function will set the UCID of any ROI withiscell==0to -1.roicat.util.discard_UCIDs_with_fewer_matches: Discard UCIDs with fewer than a specified number of matches.
Quality Control
Typically, little post-hoc curation is needed. However, defining inclusion criteria is useful for quality control. Below is a section from Nguyen et al. (Nature 2023) that describes the inclusion criteria used in their study:
Nguyen et al. (2023)
ROI masks and field-of-view images were supplied using Suite2p output files. ROICaT’s default settings were used with the following parameters: automatic hyperparameter tuning was used to align fields of view and to calculate, mix and prune pairwise ROI similarity matrices. The parameter controlling the degree of pruning in the similarity graph was slightly increased to increase cluster sizes (‘stringency’=1.3). For clustering of the final similarity matrix, ROICaT’s recommended method was used: if an experiment contained eight or more recorded sessions, ROICaT uses its standard cluster fitting method based on robust-single-linkage-clustering with the default parameters ‘min_clusters’=2 and ‘alpha’=0.999. For animals with seven or fewer recorded sessions, ROICaT’s alternative cluster fitting method based on the sequential Hungarian method algorithm was used with ‘thesh_cost’=0.6. The resulting clusters were inspected for quality using ROICaT’s output quality metrics and visualization tools, and an inclusion criterion was set using the ‘cs_sil’ metric (‘cluster similarity silhouette score’) of 0.2.
For my own data, I often use the following inclusion criteria:
cluster_silhouette > 0.2: Discard all clusters with scores below this threshold.
sample_silhouette > 0.1: Discard all ROIs with scores below this threshold. You can set their label to -1 to signify that they are unclustered samples.
Quality Metrics
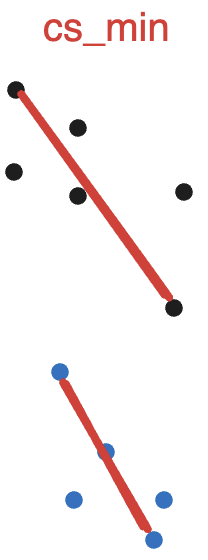
cs_min: Intra-cluster minimum similarity. Defined as the lowest pairwise similarity within a cluster. shape: (n_clusters,).
cs_max: Intra-cluster maximum similarity. Defined as the highest similarity within a cluster. shape: (n_clusters,).

cs_mean: Mean intra-cluster similarity. Defined as the average similarity within a cluster. shape: (n_clusters,).

cs_sil: Cluster silhouette score. A measure of how similar an ROI is to its own cluster compared to other clusters, which can be indicative of the appropriateness of the cluster assignment. Defined as
(intra - inter) / np.maximum(intra, inter)whereintra=cs_intra_meanandinter=cs_inter_maxOfMaxes. shape: (n_clusters,).

sample_sil: Sample silhouette score. See sklearn.metrics.silhouette_score documentation for more details. A measure of how well each ROI is clustered with its label, providing a perspective on the overall clustering quality. Defined using
sklearn.metrics.silhouette_score. shape: (n_ROIs_total,).
